Secondary port tidal heights, step by step
Offshore Theory, written by a superyacht bosun with a commercial Yachtmaster Offshore · 30 October 2026
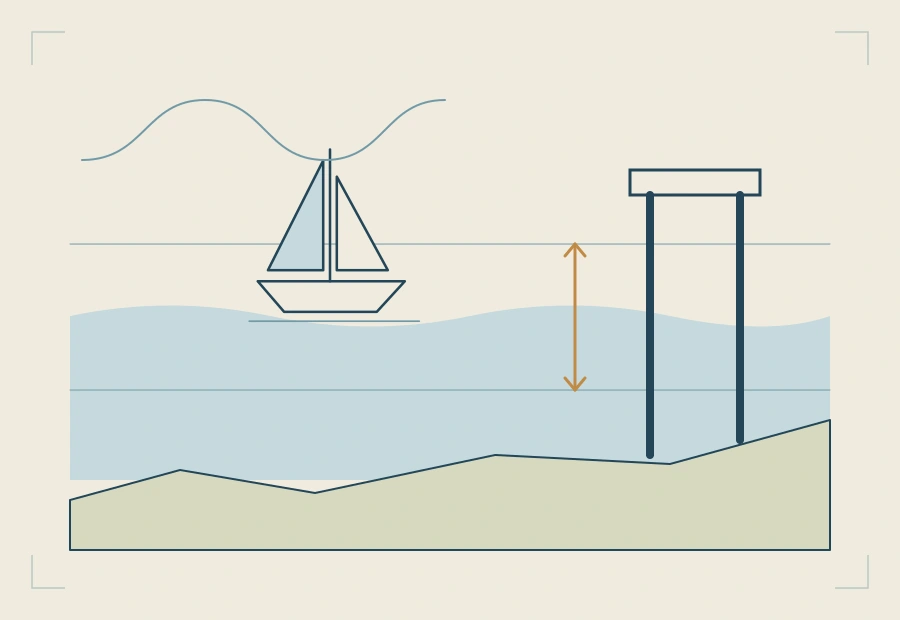
A secondary port has no tide table of its own. You take the times and heights of high and low water at its standard port, apply the differences the almanac prints for the secondary port, and then read the height for the time you need off the standard port's curve. This guide works one through, line by line.
What you need from the almanac
Three things, all on the pages for the standard port and the secondary port:
- The standard port's tide table for the day: the times and heights of the high water and low water either side of the time you are interested in.
- The secondary port's differences: a small table of time differences for high and low water, and height differences for MHWS, MHWN, MLWN and MLWS.
- The standard port's tidal curve, with its mean spring and neap ranges, to turn the day's high and low water into a height at any time.
Check which time the tables are in before you write a single number. UK tables are in UT; you convert to BST, if it applies, at the very end.
The worked example
The figures below are a round-number example made up for this guide, not a real port, so that every step can be checked by hand. The method is exactly the one you use on a real almanac page.
| Standard port, today (UT) | Time | Height |
|---|---|---|
| High water | 0900 | 5.6 m |
| Low water | 1530 | 1.2 m |
| Secondary port differences | High water | Low water | ||
|---|---|---|---|---|
| Standard port times | 0000 and 1200 | 0600 and 1800 | 0100 and 1300 | 0700 and 1900 |
| Time difference | +0010 | +0030 | −0005 | +0015 |
| Heights | MHWS | MHWN | MLWN | MLWS |
|---|---|---|---|---|
| Standard port | 6.0 | 4.8 | 2.0 | 0.8 |
| Secondary port difference | −0.6 | −0.4 | −0.2 | −0.1 |
Step 1: the time of high water
The standard port's high water is at 0900. The differences are printed for high waters at 0600 (+0030) and at 1200 (+0010). 0900 is three hours into that six-hour gap, so it is halfway.
Halfway between +0030 and +0010 is +0020. High water at the secondary port is 0900 + 0020 = 0920 UT.
Step 2: the time of low water
The standard port's low water is at 1530. The low water differences are printed for 1300 (−0005) and 1900 (+0015). 1530 is two and a half hours into that six-hour gap: 2.5 ÷ 6 = 0.42 of the way.
The difference changes by 20 minutes across the gap, from −5 to +15. 0.42 × 20 = 8 minutes, so the difference is −5 + 8 = +0003. Low water at the secondary port is 1533 UT.
Step 3: the height of high water
The standard port's high water is 5.6 m. It lies between MHWN (4.8 m, difference −0.4) and MHWS (6.0 m, difference −0.6). From 4.8 to 6.0 is 1.2 m, and 5.6 is 0.8 m of that: 0.8 ÷ 1.2 = two thirds of the way to springs.
The difference goes from −0.4 to −0.6, a change of 0.2. Two thirds of 0.2 is 0.13, so the difference is −0.53. High water at the secondary port is 5.6 − 0.53 = 5.07, call it 5.1 m.
Step 4: the height of low water
The standard port's low water is 1.2 m, between MLWS (0.8 m, difference −0.1) and MLWN (2.0 m, difference −0.2). From 0.8 to 2.0 is 1.2 m, and 1.2 is 0.4 m above MLWS: 0.4 ÷ 1.2 = one third of the way.
One third of the change (0.1) is 0.03, so the difference is −0.13. Low water at the secondary port is 1.2 − 0.13 = 1.07, call it 1.1 m. The range at the secondary port is 5.07 − 1.07 = 4.0 m.
Check these steps with the free secondary port calculator →Enter the same figures and it shows every line of the working.
Step 5: the height at a given time
Say you want the height at 1100 UT. That is 1 hour 40 minutes after high water at the secondary port (0920), so you work on the falling side, with the low water that follows it.
On the standard port's curve, write the secondary port's high water time in the box under HW and mark HW + 1h40. Decide which curve to read: the day's range at the standard port is 5.6 − 1.2 = 4.4 m, between its mean neap range (2.8 m) and mean spring range (5.2 m), so you read between the two curves, two thirds of the way towards springs. Suppose the curve gives a factor of 0.80 at that time.
The height is low water plus the factor times the range: 1.07 + 0.80 × 4.0 = 4.3 m. On the almanac's diagram you do the same thing by drawing a line from the high water height to the low water height and reading across from the curve, without any multiplication.
The factor of 0.80 is an illustration: on a real page you read it off the printed curve. How to read between the spring and neap curves is a guide of its own.
The common slips
- Picking the nearest difference instead of interpolating. On the example, that would put high water ten minutes out and its height 0.07 m out.
- Getting the sign of a difference backwards. A minus difference makes the time earlier and the height lower; write the sign on every line.
- Mixing UT and BST. Work in the table's time throughout and convert once, at the end.
- Using the wrong low water. Use the low water on the side of high water you are working: the one before for a rising tide, the one after for a falling tide.
- Using the rule of twelfths instead of the curve. It is a shortcut, not the method the curve questions expect, and it can be badly wrong at some ports.
Where this is in the course
The course works standard port heights on the curve first, on a chart made for learning, and then moves to the real English Channel almanac pages for secondary ports, including the Solent's special curves.
Using a nautical almanac: standard and secondary ports →
Free reading notes: standard and secondary ports →
Free reading notes: standard port tide tables and the tidal curve →
Questions
What is a secondary port?
A port for which the almanac does not print daily tide tables. Its times and heights are worked out from a nearby standard port, using the time and height differences printed for it.
Which tidal curve do I use for a secondary port?
The standard port's curve, unless the almanac gives the secondary port a curve of its own, as it does for the Solent ports. You enter it with the secondary port's own high water time and its own heights.
Do I interpolate the differences or just pick the nearest one?
Interpolate. The differences are printed for set standard port times and heights, and the day's figures almost never fall exactly on them. Go the same proportion of the way between the two printed differences as the day's figure lies between the two printed times or heights.
What about British Summer Time?
UK almanac tables are printed in UT (GMT). Work the whole calculation in UT, then add one hour at the end if the date falls in British Summer Time.
Is there a quick way to check my working?
Yes. The free tide height calculator on this site takes the same almanac figures and shows every step, so you can compare it line by line with your own working.
Related guides
- Springs or neaps: interpolating the tidal curveWhich curve to read on the day, and how to go part of the way between springs and neaps.
- The rule of twelfths, and when it failsThe 1, 2, 3, 3, 2, 1 shortcut worked through, and the ports and days where it gives the wrong answer.
- Clearance under the keel and drying heightsSounding plus height of tide minus draught, drying heights, and the tide you need to cross a bar.
- Tidal diamonds and the tidal stream atlasSet and rate for the hour from a diamond or the atlas, and interpolating between springs and neaps.