Tidal diamonds and the tidal stream atlas
Offshore Theory, written by a superyacht bosun with a commercial Yachtmaster Offshore · 30 October 2026
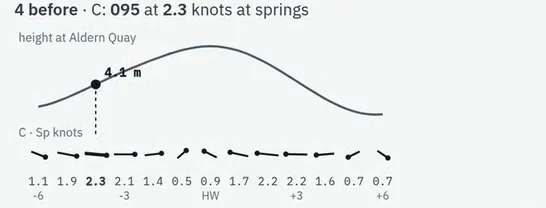
The tidal stream is the tide seen sideways: the water moving horizontally as the level rises and falls. You need its direction (the set) and its speed (the rate) for every hour of a passage, and they come from two places: the tidal diamonds on the chart and the tidal stream atlas.
What both of them give you
- Set: the direction the water is going towards, in degrees true.
- Rate: its speed in knots, given twice: at mean springs and at mean neaps.
- A time: each figure is for one hour before or after high water at a reference port, named on the chart's table or on the atlas cover.
Step 1: which hour
Find high water at the reference port for the day; that is the time the whole table hangs from. Each hourly figure applies for the hour centred on it, from half an hour before to half an hour after.
Example (round figures, made up for this guide): high water at the reference port is 0900 UT. The "HW −3" figure then applies from 0530 to 0630, the "HW −2" figure from 0630 to 0730, and so on.
Step 2: read the diamond
On the chart's tidal stream table, the column for diamond B reads:
| Hours | Direction | Rate at springs | Rate at neaps |
|---|---|---|---|
| HW −3 | 078° | 2.4 kn | 1.2 kn |
| HW −2 | 084° | 2.0 kn | 1.0 kn |
Step 3: springs, neaps or between
The rate depends on the size of the tide. Take the day's range at the reference port and compare it with that port's mean spring and neap ranges. Say the range today is 4.4 m, with mean ranges of 5.2 m at springs and 2.8 m at neaps. The day is (4.4 − 2.8) ÷ (5.2 − 2.8) = 1.6 ÷ 2.4 = two thirds of the way from neaps to springs.
- At HW −3: the rate is 1.2 + two thirds of (2.4 − 1.2) = 1.2 + 0.8 = 2.0 kn, setting 078°.
- At HW −2: 1.0 + two thirds of (2.0 − 1.0) = 1.7 kn, setting 084°.
The direction is not interpolated between springs and neaps: it is the same at both. Unlike tidal heights, stream rates may be extrapolated: if the day's range is above the mean spring range, the rate is a little more than the spring rate, and below the neap range a little less (the atlas's computation-of-rates diagram extends beyond springs and neaps for this).
The tidal stream atlas
An atlas has one page per hour, from six hours before to six hours after high water at its reference port. On each page, arrows show the direction of the stream, and each is labelled with two figures in tenths of a knot: neap rate first, spring rate second. An arrow labelled 12,24 means 1.2 knots at neaps and 2.4 knots at springs.
Use it exactly like the diamond: find the page for the hour, find the arrow nearest your position (or estimate between arrows), measure its direction with the plotter, and interpolate the rate by the day's range. On the example day, 12,24 gives 2.0 knots. Most atlases also print a small diagram for doing that interpolation graphically from the range.
Diamond or atlas?
A diamond is a measurement at one spot, and the best figure close to it. The atlas shows the pattern over a whole area: where the stream turns first, where it is strongest off a headland, and what it is doing between diamonds. For a passage, the atlas gives you the picture and the diamonds on your track give you the figures.
The common slips
- Reading the set as where the stream comes from. It is where it goes.
- Using the wrong reference port. Check the port named on the table or the atlas, not the nearest port.
- Using the hour on the clock instead of the hour from high water. Work out high water first, then count.
- Reading 12,24 as springs first. In the atlas, neaps come first.
Where this is in the course
Tidal diamonds and the tidal stream atlas →
The Channel's tidal stream atlas, referred to Dover →
Free reading notes: tidal diamonds and the atlas →
Questions
What is a tidal diamond?
A magenta diamond with a letter on the chart, marking a place where the tidal stream has been measured. A table on the chart gives, for that letter, the stream's direction and its spring and neap rates for each hour before and after high water at a named standard port.
Is the direction where the stream comes from or where it goes?
Where it goes. The set is the direction the water is moving towards, in degrees true. That is the opposite of how wind is described.
Which hour do I use?
Each hourly figure applies from half an hour before that hour to half an hour after it. With high water at 0900, the HW minus 3 figure applies from 0530 to 0630.
How do I read the numbers on a tidal stream atlas?
Each arrow is labelled with two figures, such as 12,24: the neap rate and the spring rate in tenths of a knot, here 1.2 and 2.4 knots. The direction is the direction of the arrow.
Diamond or atlas: which is better?
A diamond gives a measured figure at one place; the atlas gives the pattern over a whole area. Use the diamond close to it, and the atlas between diamonds or for the overall picture of a passage.
Related guides
- Springs or neaps: interpolating the tidal curveWhich curve to read on the day, and how to go part of the way between springs and neaps.
- Course to steer and the tidal triangleThe one-hour vector triangle drawn step by step, with leeway, and down to a compass course.
- Set, drift and the estimated positionFrom the dead reckoning to the EP: the stream for the time run, leeway, and the triangle drawn the right way.
- Planning a passage, step by stepFrom the question of whether to go, through the tide at each end and the stream, to the plan on one page.