Clearance under the keel and drying heights
Offshore Theory, written by a superyacht bosun with a commercial Yachtmaster Offshore · 30 October 2026
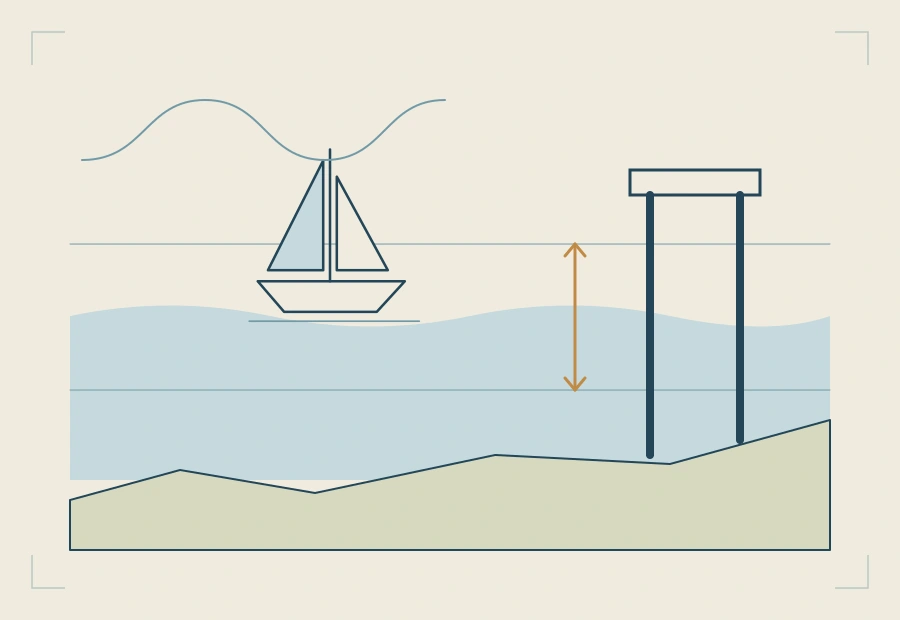
Every figure that decides whether you float is measured from one line: chart datum. Soundings go down from it, drying heights go up from it, and the height of tide is how far the water is above it right now. Put those together with your draught and you know what is under the keel, and when it is enough.
The two sums
- Over a sounding (a depth below chart datum): depth of water = sounding + height of tide.
- Over a drying height (underlined on the chart, a height above chart datum): depth of water = height of tide − drying height.
Then the clearance under the keel is the depth of water minus your draught. The safety margin is what you want left over; the chart does not give it to you, you decide it.
Worked example 1: a bar with a sounding
A bar across a harbour entrance is charted at 1.2 m. The boat draws 1.9 m and the skipper wants 0.5 m under the keel.
The depth needed is 1.9 + 0.5 = 2.4 m. The chart already gives 1.2 m of it, so the tide must give the rest: 2.4 − 1.2 = 1.2 m of height of tide. Whenever the height of tide is 1.2 m or more, she crosses with half a metre to spare.
Worked example 2: a patch that dries
A short cut over a sandbank is marked with a drying height of 2.3 m (the figure is underlined). Same boat, same margin: she needs 2.4 m of water.
The tide first has to cover the bank, 2.3 m, and then give the 2.4 m on top: 2.3 + 2.4 = 4.7 m of height of tide. If high water on the day is only 4.4 m, the short cut is not open at all.
The two examples are why a drying height is easy to misread: the bigger the underlined figure, the shallower the place.
Worked example 3: correcting the echo sounder
The transducer is 0.4 m below the waterline and the keel 1.9 m. The sounder is set to show depth below the transducer and reads 3.0 m.
- Depth of water: 3.0 + 0.4 = 3.4 m.
- Under the keel: 3.4 − 1.9 = 1.5 m (or 3.0 − 1.5, the keel being 1.5 m below the transducer).
- To compare with the chart, take off the height of tide. If the height of tide is 2.1 m, the charted depth under you should be about 3.4 − 2.1 = 1.3 m. A depth contour or a sounding near that figure is a useful check on your position.
Worked example 4: clearance under a bridge
A bridge has a charted vertical clearance of 12.0 m. On current Admiralty charts that is measured above Highest Astronomical Tide (HAT); check the chart's notes, as some older charts used a different level. HAT at the nearby port is 6.4 m above chart datum, and the height of tide now is 3.1 m.
The water is 6.4 − 3.1 = 3.3 m below HAT, so the clearance now is 12.0 + 3.3 = 15.3 m. With a masthead, aerials included, 14.0 m above the waterline, there is 1.3 m to spare. The danger runs the other way from the keel: the higher the tide, the less room above.
Choosing the safety margin
No chart and no almanac gives you the margin. Make it bigger when the boat will move up and down in a swell or a sea, over rock rather than sand or mud, at night or in poor visibility, when the soundings are old or sparse, and when the height of tide itself is an estimate. Make it smaller only when the bottom is soft, the water flat and the figures firm.
Where this is in the course
Under-keel clearance and overhead clearance →
Chart datum, tide levels and range →
Free reading notes: under-keel and overhead clearance →
Free reading notes: soundings, contours and drying heights →
Questions
What is the difference between a sounding and a drying height?
Both are measured from chart datum. A sounding is a depth below it: water you have even at the lowest tide. A drying height, underlined on the chart, is a height above it: ground that stands out of the water until the tide covers it.
How do I find the height of tide I need to cross a shallow patch?
Add your draught and the safety margin you want, and subtract the charted depth. Over a drying patch, add the drying height instead of subtracting.
How big should the safety margin be?
That is the skipper's decision, not a number from the chart. Make it larger in a swell or a sea, over rock rather than sand or mud, at night, and when the tidal figures are uncertain.
What does the echo sounder actually show?
Whatever it has been set to show: depth below the transducer, below the keel, or below the waterline with an offset. Know which, and correct it before comparing it with the chart.
What is bridge clearance measured from?
On current Admiralty charts, vertical clearances are given above Highest Astronomical Tide. Check the chart's own notes, as some older charts used a different level. The clearance increases as the tide falls below that level.
Related guides
- Secondary port tidal heights, step by stepTimes and heights at a secondary port from the standard port and its differences, with a worked example.
- Springs or neaps: interpolating the tidal curveWhich curve to read on the day, and how to go part of the way between springs and neaps.
- The rule of twelfths, and when it failsThe 1, 2, 3, 3, 2, 1 shortcut worked through, and the ports and days where it gives the wrong answer.
- Planning a passage, step by stepFrom the question of whether to go, through the tide at each end and the stream, to the plan on one page.