Springs or neaps: interpolating the tidal curve
Offshore Theory, written by a superyacht bosun with a commercial Yachtmaster Offshore · 30 October 2026
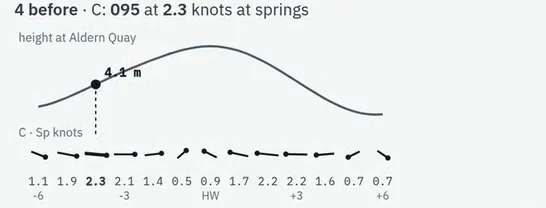
A standard port's tidal curve has two lines on it: one for spring tides and one for neaps. On most days the tide is neither, and the curve you should read lies somewhere between the two. This guide shows how to tell how far between, and how to read a height or a time from there.
Step 1: the day's range
The range is the difference between high water and low water. Take the standard port's high water for the day, and the low water on the side of it you are working: the low water before it for a rising tide, the one after it for a falling tide.
Beside the curve the almanac prints the standard port's mean spring range and mean neap range. Those two figures are the ends of the scale; the day's range tells you where you are on it.
Step 2: how far towards springs
Take this example, made up for the guide so that every figure can be checked: high water 0900, 5.6 m; the low water before it 0245, 1.2 m. The range is 5.6 − 1.2 = 4.4 m. The standard port's mean ranges are 5.2 m at springs and 2.8 m at neaps.
From neaps to springs is 5.2 − 2.8 = 2.4 m. The day is 4.4 − 2.8 = 1.6 m above neaps. 1.6 ÷ 2.4 = 0.67: the day is two thirds of the way from neaps to springs.
- At or above the mean spring range: read the spring curve only.
- At or below the mean neap range: read the neap curve only.
- In between: go the same proportion of the way from the neap curve to the spring curve.
Step 3: the height at a given time
You want the height at 0700, two hours before high water. On the curve, at HW −2, suppose the spring curve reads a factor of 0.70 and the neap curve 0.76. Two thirds of the way from 0.76 towards 0.70 is 0.76 − (0.06 × 0.67) = 0.72.
The height is the low water plus the factor times the range: 1.2 + 0.72 × 4.4 = 1.2 + 3.17 = 4.4 m.
On the almanac diagram the same answer comes without arithmetic: mark the high water height on the top scale and the low water height on the bottom scale, join them with a line, go up from the time to the curve (between the two lines), across to your sloping line, and up or down to the height scale.
Step 4: the time for a height you need
Now turn it round. You need 3.0 m of tide to cross a bar. The factor you need is the height above low water divided by the range: (3.0 − 1.2) ÷ 4.4 = 0.41.
Suppose the spring curve reaches 0.41 at HW −3h20 and the neap curve at HW −3h40. The two are 20 minutes apart; two thirds of the way from the neap time to the spring time is 13 minutes, so the time is HW −3h27. With high water at 0900, that is about 0533. Any time after that, until the falling tide drops back below 3.0 m, the height is enough.
The factors and times here illustrate the method; on a real page you read them off the printed curves, at the standard port's own scale.
Why it matters
At some ports the spring and neap curves are almost on top of each other and the choice hardly changes the answer. At others they part company, above all near low water, and reading the wrong one can move a time by tens of minutes: the difference between crossing a bar with water to spare and touching it.
The common slips
- Using the secondary port's range to choose the curve. The curve is the standard port's; its range decides.
- Using the low water on the wrong side of high water. It changes the range, and with it the proportion.
- Extrapolating beyond springs or below neaps. Stay on the outer curve.
- Forgetting the time zone. The curve is entered with the table's time; convert to BST at the end.
Where this is in the course
Standard port tide tables and the tidal curve →
Chart datum, tide levels and range →
Free reading notes: standard port tide tables and the tidal curve →
Free secondary port tidal height calculator →
Questions
How do I know if it is springs or neaps?
Work out the day's range at the standard port, high water height minus the low water height on the side you are working, and compare it with the standard port's mean spring range and mean neap range printed beside its curve.
What if the range is bigger than the mean spring range?
Use the spring curve. Do not extrapolate beyond it. In the same way, a range smaller than the mean neap range uses the neap curve.
Which range do I use for a secondary port?
The standard port's range decides which curve to read, because the curve belongs to the standard port. The secondary port's own heights then give the height you read off.
Does the same proportion work for tidal streams?
Yes. The rate of a tidal diamond or of the stream atlas is interpolated between its neap and spring rates by the same proportion of the range. Unlike tidal heights, stream rates may be extrapolated: above the mean spring range the rate is a little more than the spring rate, and below the neap range a little less.
Do I have to interpolate if the two curves are almost the same?
If the two curves are close at the time you want, the difference is small and you can say so. If they are apart, go part of the way between them: on some ports it changes the answer by tens of minutes.
Related guides
- Secondary port tidal heights, step by stepTimes and heights at a secondary port from the standard port and its differences, with a worked example.
- The rule of twelfths, and when it failsThe 1, 2, 3, 3, 2, 1 shortcut worked through, and the ports and days where it gives the wrong answer.
- Clearance under the keel and drying heightsSounding plus height of tide minus draught, drying heights, and the tide you need to cross a bar.
- Tidal diamonds and the tidal stream atlasSet and rate for the hour from a diamond or the atlas, and interpolating between springs and neaps.